India has committed to 500 GW of non-fossil fuel energy capacity by 2030, with solar expected to contribute nearly 280–300 GW. While the central government has laid out strong frameworks and subsidy schemes, the real implementation lies with states.
Unfortunately, policy inconsistencies at the state level — especially around rooftop and distributed solar — are slowing progress. To unlock India’s full solar potential, we need to understand where these gaps exist.
Why State-Level Policies Matter for Solar Adoption
Electricity in India is a concurrent subject — both the Centre and states share responsibility.
The Ministry of New and Renewable Energy (MNRE) sets national policies and subsidies.
But states control the critical details, including:
Net metering approvals
Tariff structures for exported solar power
Grid connectivity timelines
Open access rules for industries
The result is a patchwork of regulations, where what works in Gujarat or Karnataka may not work in Uttar Pradesh or Bihar — creating uncertainty for both consumers and investors.
Key Policy Inconsistencies Slowing Growth
1. Net Metering Caps and Restrictions
Some states cap rooftop systems at 10 kW for homes or 1 MW for industries.
DISCOMs often delay or deny approvals, citing technical limits.
Settlement periods differ — monthly in some states, yearly in others — changing payback economics.
2. Tariff Variations and Unpredictability
Surplus solar export tariffs vary widely (₹2.25/kWh in some states vs ₹4/kWh in others).
Sudden retroactive cuts in tariffs have led to legal disputes and financial losses.
3. Open Access and Wheeling Charges
C&I (commercial & industrial) projects face cross-subsidy surcharges, wheeling charges, and banking charges that differ by state.
Some states restrict banking periods to 15–30 days, reducing project viability.
4. Delays in Approvals and Grid Connectivity
Cumbersome paperwork and manual processes slow rooftop adoption.
Lack of digital integration increases uncertainty for developers.
5. Lack of Uniform Subsidy Implementation
Central subsidies under Pradhan Mantri Surya Ghar: Muft Bijli Yojana are often delayed at the state DISCOM level.
Few states offer additional incentives, limiting uptake among residential consumers.
Impact of Policy Fragmentation
Rooftop Solar Lag → Less than 20% of India’s solar capacity comes from rooftops, far behind the target.
Investor Hesitation → Developers avoid states with unpredictable or changing policies.
Higher Costs for Consumers → Lack of scale keeps solar prices higher in restrictive states.
Slower Industrial Adoption → C&I users — who could benefit the most — are discouraged by extra surcharges.
What Can Be Done to Harmonize Policies?
1. Central Guidelines with Minimum Standards
MNRE should enforce uniform net metering, open access, and tariff benchmarks across all states.
2. Digitalization of Processes
Expand national-level portals (like the rooftop solar portal) to all states for faster, transparent approvals.
3. Stable, Long-Term Tariff Policies
States must provide predictable, fixed-term export tariffs and avoid retroactive changes.
4. Standardized Banking & Wheeling Rules
A common framework for banking duration and wheeling charges would make C&I solar more attractive nationwide.
5. Capacity Building for DISCOMs
Train and incentivize DISCOMs to:
Process applications efficiently
Integrate rooftop solar smoothly
View solar as a partner for grid stability, not a competitor.
Expert Insight
“Solar adoption is slowed less by technology or financing, and more by uncertainty. A stable, uniform regulatory framework will do more for solar adoption than any subsidy.” — Dr. Ramesh Iyer, Energy Policy Expert
Introduction: Rising Power Costs Make Solar More Attractive
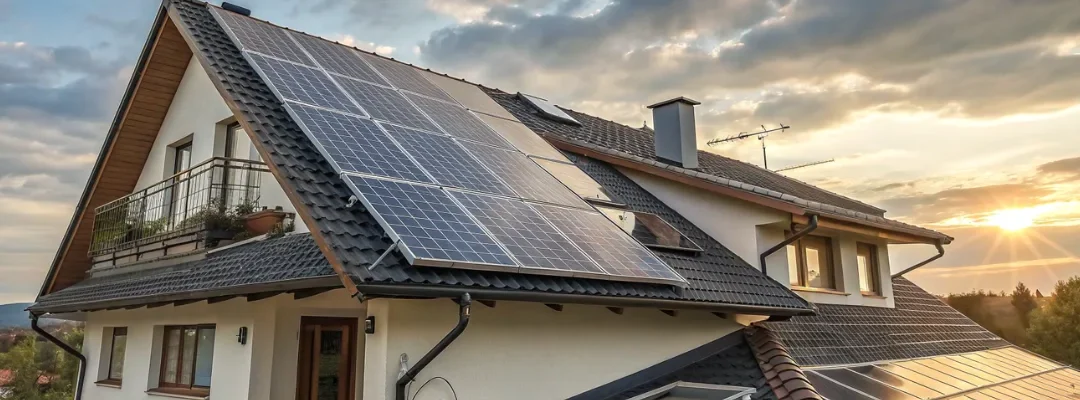
Electricity prices in India have risen steadily, with households in cities paying ₹5,000–₹8,000 per month in electricity bills. This has made rooftop solar energy not just an eco-friendly choice—but a financially smart investment.
Among various options, a 4 kW rooftop solar system has proven ideal for average Indian homes, with the potential to cut electricity bills to zero—thanks to its energy generation capacity and the net metering policy.
How Much Power Does a 4 kW Solar System Generate?
A 4 kW solar system typically generates:
16–20 kWh per day
~500–600 units per month
Equivalent to ₹5,000–₹7,000/month in electricity savings
This is enough to cover energy needs like:
Lights, fans, refrigerators, and washing machines
1–3 AC units (moderate usage)
TVs, Wi-Fi routers, kitchen appliances, laptops, and other devices
Net Metering Benefit Any excess solar power is sent back to the grid. These exported units are credited against your electricity usage—reducing your bill to ₹0 in many cases.
Financial Breakdown: Real Savings and ROI
Cost of a 4 kW System (2025 Estimate)
Gross Cost: ₹2,20,000 – ₹2,60,000
MNRE Subsidy (40% for ≤3kW + 20% for remaining 1kW): ~₹85,000
Net Cost: ₹1,35,000 – ₹1,75,000
Annual Savings
₹60,000–₹85,000/year in bill savings
Payback Period: 4–6 years
Free electricity for 15–20 years after payback
“Our 4 kW system paid for itself in 4.5 years. Since then, no bills—just savings,” shares Mr. Rao, homeowner from Hyderabad.
Environmental Impact: Clean Energy for a Cleaner Planet
Each 4 kW rooftop solar system reduces your carbon footprint by:
4–5 tons of CO₂/year
Equivalent to planting over 100 trees annually
Reduces dependence on fossil fuels and stabilizes the grid
Is a 4 kW Solar System Right for Your Home?
Ideal For:
Households with monthly bills of ₹5,000–₹8,000
2–3 BHK homes with moderate to high appliance usage
Homes using 2–3 ACs, fridges, geysers, washing machines
Space Needed:
350–400 sq. ft. of unshaded rooftop space
Flat RCC rooftops or metal sheds are suitable
South-facing orientation preferred for optimal performance
Bonus Features: Hybrid & Backup Options
A 4 kW system can be integrated with:
Hybrid inverters for solar + grid + battery usage
Lithium or lead-acid batteries for backup during power cuts
Smart monitoring apps to track energy generation
Government Support & Net Metering Explained
MNRE Subsidy: 40% for the first 3kW and 20% for next 2kW (capped at 10kW)
Net Metering: Any unused solar energy is exported to the grid; you get credits
Loans: Green loans and EMI options available from SBI, HDFC, and others
Note: Work with MNRE-registered installers to ensure subsidy eligibility.
Expert Insight: Efficiency Depends on Design
“System size alone doesn’t guarantee bill reduction. Correct orientation, inverter quality, and real-time monitoring are crucial,” says Dr. Meera Patel, Solar Systems Engineer.
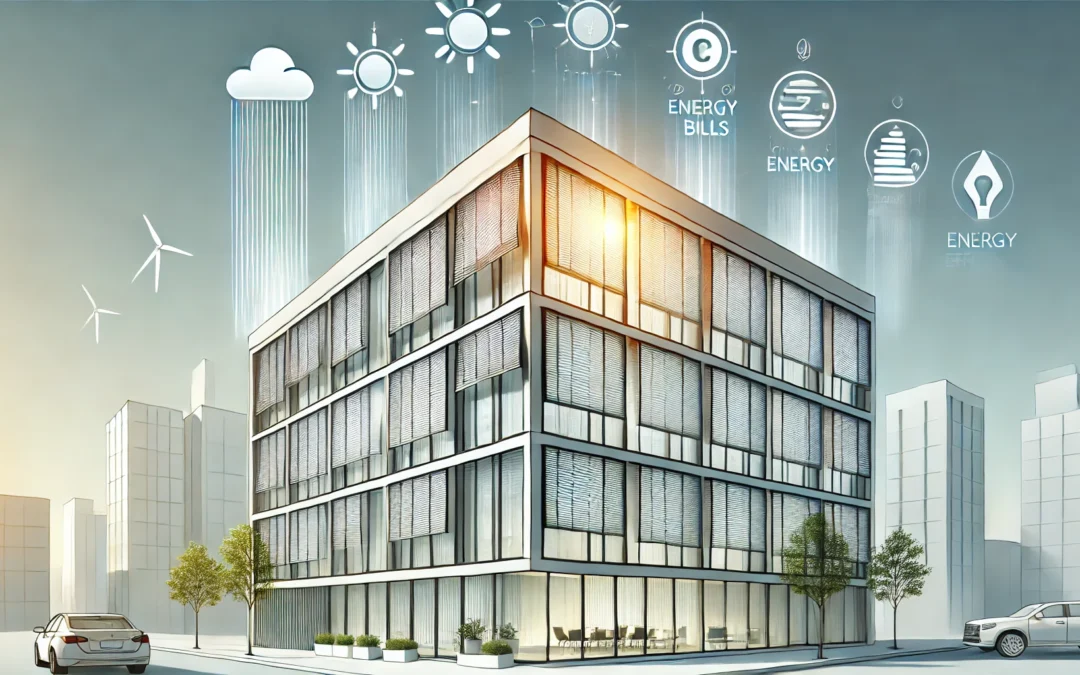
Solar screens are an innovative solution that offers both aesthetic appeal and practical benefits for buildings. These screens, designed to block a significant portion of the sun’s heat and UV rays, provide numerous advantages, especially when it comes to energy efficiency and overall building aesthetics. Here’s how solar screens can make a difference:
1. Cut Cooling Costs with Improved Energy Efficiency
Solar screens act as a protective barrier, blocking a significant portion of the sun’s heat before it enters your building. This leads to cooler indoor spaces and reduced reliance on air conditioning—particularly during India’s scorching summers. In many cases, this translates to up to 30% savings on cooling expenses, making solar screens an energy-smart upgrade for any climate.
2. Shield Interiors from Fading with UV Protection
With the ability to block up to 90% of harmful UV rays, solar screens help preserve the condition of furniture, flooring, curtains, and artwork. By minimizing direct sunlight exposure, they extend the lifespan of your interiors and reduce the need for frequent refurbishing or replacement.
3. Enhance Your Building’s Exterior Aesthetic
Solar screens are available in various colors, weaves, and design patterns, allowing for full customization to suit your building’s architectural style. Whether you're modernizing a commercial property or adding curb appeal to your home, these screens add a sleek and polished finish to windows without compromising on function.
4. Enjoy Natural Light Without the Glare
Bright rooms don’t have to come with uncomfortable glare. Solar screens soften incoming light, reducing eye strain and enhancing the usability of indoor spaces—especially those with screens or reflective surfaces. They strike the perfect balance between visibility and comfort.
5. Maintain Daytime Privacy with Outdoor Views
These screens work like one-way filters—obscuring the view from the outside during the day while preserving clear sightlines from inside. This makes them ideal for urban buildings, street-facing windows, or high-traffic environments where privacy is key.
6. Eco-Friendly Solution
Solar screens are a smart choice for green buildings. By reducing the need for air conditioning, they help lower electricity use and cut down on your building’s carbon footprint. These energy-saving window solutions support eco-friendly construction practices and make your home or office more sustainable. It's a small upgrade with a big impact on the environment. Combining solar screens with home solar solutions can further enhance energy savings.
7. Durable and Easy to Maintain
Built from long-lasting materials like fiberglass or PVC-coated polyester, solar screens can endure intense sun, wind, and rain. They resist fading, sagging, and tearing—requiring only occasional cleaning with a soft cloth or mild soap and water.
8. Versatile Installation Options
Solar screens offer flexible installation options to suit any property. They can be mounted inside or outside windows, and come in fixed panels or roll-up designs. This makes them ideal for homes, offices, apartments, and even industrial buildings. Whether you're building a new structure or upgrading an existing one, solar screens work great as a retrofit window shading solution or as part of a modern energy-efficient design.
9. Health Benefits: Reducing Sun Exposure
For occupants who spend long hours indoors, solar screens offer health benefits by reducing exposure to harmful UV rays. This can lower the risk of skin damage and other related health issues caused by excessive sun exposure.
10. Cost-Effective Investment
While solar screens require an upfront investment, the energy savings, extended lifespan of furnishings, and added value to the building’s aesthetics make them a cost-effective choice. Over time, the reduced energy bills can pay for the installation cost, providing both financial and environmental returns.
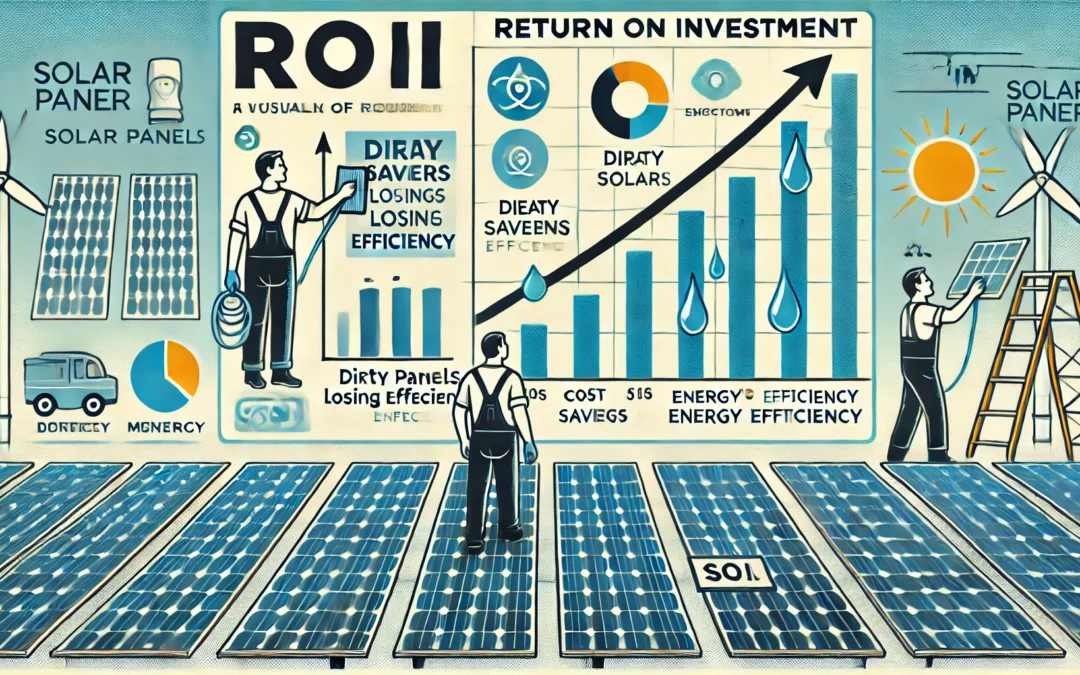
Calculating the Return on Investment (ROI) for a solar panel cleaning system is essential for any solar energy user or facility manager aiming to maximize long-term energy output and financial returns. Over time, solar panels accumulate dust, dirt, bird droppings, and other environmental debris that can reduce their energy efficiency by 10% to 30%—especially in high-dust or industrial areas.
At SynergySolar, a leading solar panel company, we understand that even the best solar installations need regular maintenance to perform at peak levels. Investing in a professional or automated solar panel cleaning system not only restores lost energy production but also extends the life of your panels, ensuring better financial returns on your renewable energy investment.
By maintaining clean panel surfaces, a solar cleaning system helps recover lost efficiency and ensures consistent energy generation—resulting in higher savings and a faster payback period.
1. Calculate the Cost of the Solar Panel Cleaning System
Start by determining the total investment required for the solar panel cleaning system. This includes:
Initial cost of the system: The cost of the cleaning equipment (manual, semi-automatic, or automatic).
Installation Charges: If it's an automated cleaning system, installation costs must be considered.
Operational and maintenance costs: Include water, electricity, labor (if applicable), and routine maintenance.
Formula:
Total Investment Cost = Cleaning System Cost + Installation Cost + Annual Operational Costs
2. Estimate the Energy Loss Due to Dirty Panels
Determine the energy loss percentage caused by dirt accumulation. Solar panels typically lose between 10% to 25% efficiency depending on environmental conditions like dust, pollution, or bird droppings.
For example, if your panels lose 15% efficiency due to dirt, and you’re producing 10,000 kWh annually, your lost energy output would be:
Lost Energy = 10,000 kWh × 0.15 = 1,500 kWh/year
3. Estimate the Energy Gain After Cleaning
Once you install a cleaning system, you can expect to regain the lost energy. Calculate the additional energy generated due to maintaining clean panels.
Energy Gain After Cleaning = Lost Energy
4. Calculate the Monetary Value of Energy Gain
To convert the additional energy into financial savings, use the local electricity rate (typically expressed as the cost per kWh).
If the local rate is $0.10 per kWh:
Annual Savings = Energy Gain After Cleaning × Electricity Rate
The payback period is the time it will take for the savings from the cleaning system to cover the initial investment.
Payback Period = Total Investment Cost / Annual Savings
If your total cleaning system cost is $1,000, and you save $150 annually, the payback period would be:
Payback Period=1,000/150 = 6.67 years
6. Calculate ROI
ROI is calculated by comparing the net returns (total savings over a period minus the initial investment) to the initial investment.
ROI = Total Savings Over Period − Total Investment Cost / Total Investment Cost ×100
If you expect the cleaning system to last for 10 years, your total savings over that period would be:
Total Savings Over 10 Years = 150 USD/year × 10 = 1,500 USD
Thus, the ROI would be:
ROI = 1,500−1,000 / 1,000 × 100=50%
7. Additional Considerations
Panel size and location: Larger solar installations in dusty or pollution-prone areas will see higher energy losses, which means more potential savings from regular cleaning.
Cleaning frequency: The frequency of cleaning (monthly, quarterly, etc.) will influence both operational costs and the amount of energy regained.
Degradation over time: Panels degrade naturally over time, but regular cleaning can help slow efficiency loss, which should be factored into long-term ROI calculations.
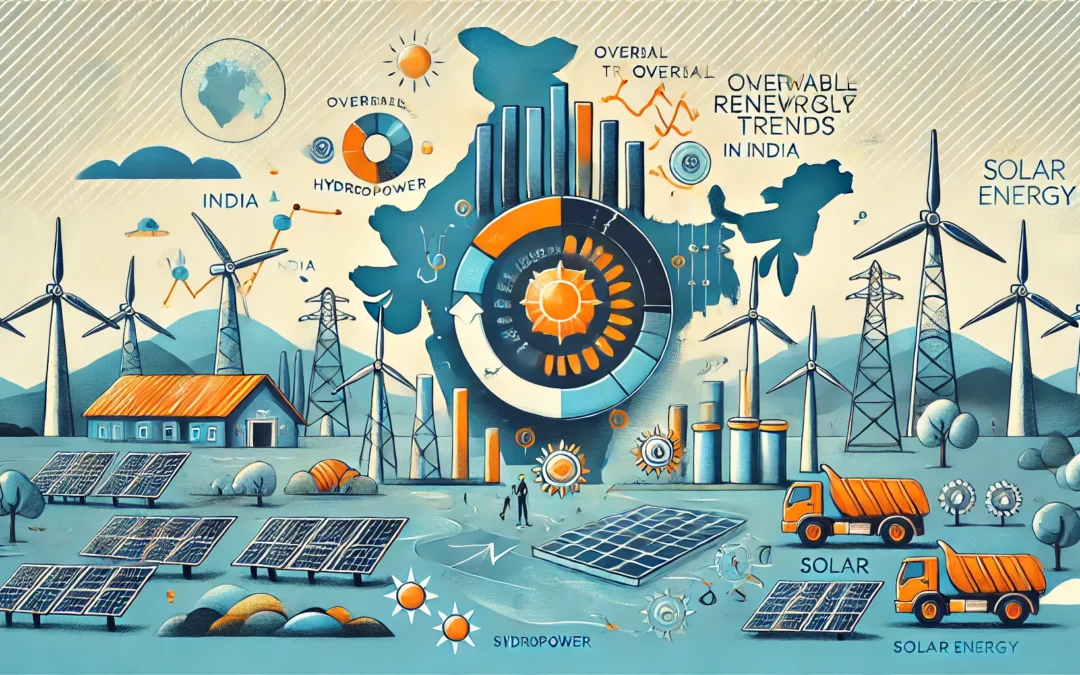
India is making significant strides in its energy sector, particularly focusing on the shift from conventional energy sources to renewable energy (RE). Solar energy, in particular, has emerged as a key player within the renewable energy landscape. Below is a comparative analysis of the overall renewable energy trends versus solar energy trends in India.
1. Renewable Energy Trends in India
India has established itself as one of the global leaders in renewable energy. The country is making continuous efforts to diversify its energy mix, with a strong emphasis on increasing the share of renewable sources like wind, solar, hydro, and bioenergy.
Key Trends in India's Renewable Energy Sector:
Installed Renewable Energy Capacity:
As of 2023, India's total renewable energy capacity stands at approximately 125 GW, which includes solar, wind, hydro, and bioenergy.
The government has set a goal of achieving 500 GW of non-fossil fuel energy capacity by 2030 to meet its climate and energy security objectives.
Diverse Energy Mix:
Wind Energy: India has a significant share of wind energy, with an installed capacity of over 42 GW. Coastal states like Tamil Nadu and Gujarat are leading in wind power generation.
Hydropower: India's hydropower potential is substantial, with a current installed capacity of over 46 GW. Large hydropower projects are crucial for balancing grid reliability and renewable energy integration.
Bioenergy: India is harnessing bioenergy from agricultural waste, municipal waste, and biomass, contributing approximately 10 GW to its renewable energy capacity.
Government Initiatives and Policies:
National Solar Mission: Launched in 2010, the mission aims to make India a global leader in solar power. The focus has been on large-scale solar projects and promoting rooftop solar installations.
Incentives and Subsidies: The government offers several incentives, such as capital subsidies, tax rebates, and accelerated depreciation, to promote investment in renewable energy.
Emerging Technologies:
Emerging Tech: India is exploring green hydrogen, pumped hydro storage, and smart grid integration to enhance RE capacity.
Challenges: Issues like land acquisition, financing, and intermittency continue to affect large-scale deployment.
Challenges:
Grid Integration: The intermittent nature of renewable energy sources presents challenges for grid stability. Efforts are underway to modernize the grid and enhance energy storage solutions.
Land Acquisition: Acquiring land for large-scale renewable energy projects, especially in densely populated areas, remains a challenge in India.
2. Solar Energy Trends in India
Solar energy is the most prominent segment of India's renewable energy sector. India is one of the fastest-growing markets for solar energy, and the country is poised to be a global solar powerhouse.
Key Solar Energy Trends in India:
Installed Solar Capacity:
India's installed solar power capacity exceeded 70 GW by the end of 2023. The country has set a target of 280 GW of solar capacity by 2030 as part of its broader renewable energy goals.
India is ranked among the top 5 countries globally in terms of installed solar power capacity.
Growth of Utility-Scale Solar:
Large-scale solar parks are the backbone of India's solar power generation. Projects like the Bhadla Solar Park in Rajasthan, one of the largest in the world, demonstrate India's focus on utility-scale solar.
States like Gujarat, Rajasthan, and Tamil Nadu are leading the country in solar capacity due to their vast land availability and high solar radiation.
Rooftop Solar Boom:
The rooftop solar market is growing rapidly, with a target of 40 GW of rooftop solar capacity by 2022. While India has yet to meet this target, the market is expanding in urban areas, commercial buildings, and industrial sectors. Reliable solar panel company in India provide turnkey solutions for homeowners and businesses.
Government schemes like PM-KUSUM promote solar installations for farmers, incentivizing solar pumps and solar irrigation systems, especially for off-grid rural areas.
Solar-Wind Hybrid Projects:
Solar-Wind Hybrids are being deployed to enhance power consistency and grid performance.
Innovations include:
Bifacial PV panels that capture light on both sides
Floating solar farms on reservoirs and canals
Solar tracking systems that follow the sun for higher efficiency
Cost Decline and Technology Advancements:
The cost of solar energy has fallen dramatically in the last decade due to advancements in technology, economies of scale, and competitive bidding in government auctions. As of 2023, solar tariffs in India are some of the lowest globally, at around INR 2 per kWh.
Advances in solar PV technologies such as bifacial solar panels, floating solar plants, and solar tracking systems are further driving the growth of solar energy in India.
Solar Manufacturing and Domestic Production:
To reduce import dependency, India is investing in local production under the PLI (Production Linked Incentive) scheme.
This includes manufacturing solar modules, cells, inverters, and batteries.
Solar Energy Storage:
Solar power generation is being coupled with energy storage systems (ESS) like lithium-ion batteries. This integration addresses the intermittency of solar energy, providing backup power during non-sunlight hours and stabilizing the grid.
Comparison: Renewable Energy vs. Solar Energy Trends in India
Aspect
Renewable Energy Trends
Solar Energy Trends
Installed Capacity
125 GW overall (wind, solar, hydro, bioenergy)
70 GW solar capacity (2023)
Growth Focus
Balanced focus on wind, hydro, solar, and bioenergy
Solar is the dominant growth sector with utility-scale and rooftop solar
Policy Support
National policies for various RE sectors; incentives for all RE types
Special focus on solar through National Solar Mission, PM-KUSUM, etc.
Cost Trends
Wind and hydro energy costs remain steady; bioenergy still evolving
Solar costs have dropped significantly, making it one of the cheapest energy sources
Challenges
Grid integration, land acquisition, financing
Land use, supply chain for domestic manufacturing, intermittency
Technology Focus
Wind-solar hybrids, green hydrogen, energy storage
Solar storage, advanced PV tech, floating solar, solar-wind hybrids